There are limited case studies in the literature that highlight with evidence large deformations in unsaturated soil slopes prior to reaching failure conditions[1–3]. The shear strength of the soils in such slopes typically drops from the peak shear strength (PSS) to a low and constant value with increasing shear deformation. Such a behavior is widely referred to in the literature as strain-softening behavior[4]. The low and constant shear strength value that these soils reach at failure conditions is referred to as the residual shear strength (RSS) of the soil. The RSS and the strain-softening behavior must be considered for the rational analysis and design of the slopes that undergo large deformation prior to reaching failure conditions. The importance of RSS of soil in the long-term stability analysis of fine-grained soils is widely accepted and used in the analyses of progressive failure of saturated soil slopes[5–6]. More recently, Qi & Vanapalli [7] highlighted the importance of RSS in slope stability analysis of unsaturated slopes.
The RSS of saturated soils has been investigated by several researchers in the literature. Lupini[8] and Skempton[9]et al. explained failure mechanism of soil slopes associated with the RSS. Empirical relationships between the RSS parameters and soil physical parameters (e.g. liquid limit, plasticity index and clay particle fraction, etc.) have been proposed for saturated soils to estimate the RSS of soils[10–12]. The strain softening behavior of unsaturated soils is however different from that of saturated soils. Some researchers highlighted with experimental evidence that soil suction significantly influences the RSS of unsaturated soils[13–15]. The contribution of matric suction on the RSS can be interpreted by modifying the shear strength of unsaturated soils (i.e., Eq. (1)) proposed by Fredlund et al.[16] to Eq. (2). The modifications include replacement of peak shear strength (PSS) parameters with the corresponding residual values:
| ${\tau _{\rm p}}={c'_{\rm p}}+\left( {{\sigma _{\rm n}}-{u_{\rm a}}} \right)\;\tan \; {\phi '_{\rm p}}+\left( {{u_{\rm a}}-{u_{\rm w}}} \right)\;\tan \; \phi _{\rm p}^{\rm b}$ | (1) |
| ${\tau _{\rm r}}={c'_{\rm r}}+\left( {{\sigma _{\rm n}}-{u_{\rm a}}} \right)\;\tan \; {\phi '_{\rm r}}+\left( {{u_{\rm a}}-{u_{\rm w}}} \right)\;\tan \; \phi _{\rm r}^{\rm b}$ | (2) |
where
The peak and residual shear strength parameters for saturated soils can be obtained from conventional laboratory tests. However, determination of the shear strength parameters from laboratory tests for unsaturated soils is cumbersome and time consuming. For this reason, shear strength contribution arising from matric suction for PSS (i.e.,
| ${\tau _{\rm p}}={c'_{\rm p}}+\left( {{\sigma _{\rm n}}-{u_{\rm a}}} \right)\;\tan \; {\phi '_{\rm p}}+\left( {{u_{\rm a}}-{u_{\rm w}}} \right)\;({S^\kappa })\;\tan \; {\phi '_{\rm p}}$ | (3) |
| ${\tau _{\rm p}}={c'_{\rm p}}+\left( {{\sigma _{\rm n}}-{u_{\rm a}}} \right)\;\tan \; {\phi '_{\rm p}}+\left( {{u_{\rm a}}-{u_{\rm w}}} \right)\;\left(\frac{{\theta - {\theta _{\rm r}}}}{{{\theta _{\rm s}}- {\theta _{\rm r}}}}\right)\;\tan \; {\phi '_{\rm p}}$ | (4) |
where
Infante Sedano & Vanapalli [13] presented a model (i.e., Eq. (5)) to predict the RSS of unsaturated soils, which is similar to Eq. (3). In this model, a new fitting parameter
| ${\tau _{\rm r}}={c'_{\rm r}}+\left( {{\sigma _{\rm n}}-{u_{\rm a}}} \right)\;\tan \; {\phi '_{\rm r}}+\left( {{u_{\rm a}}-{u_{\rm w}}} \right)\;({S^{{\kappa _{\rm r}}}})\;\tan \; {\phi '_{\rm r}}$ | (5) |
However, Eq. (5) was proposed based on apparent SWCC of the sheared specimen, which reflects the residual conditions of the soil. In other words, a test specimen that is sheared to the residual state (i.e., large deformation) should be used in the conventional pressure plate apparatus to obtain a SWCC. However, it is time consuming and expensive to obtain such a SWCC.
Yang & Vanapalli [18] proposed a new model to predict the RSS of unsaturated soils, which is expressed as:
| ${\tau _{\rm r}}={c'_{\rm r}}+\left( {{\sigma _{\rm n}}-{u_{\rm a}}} \right)\;\tan \; {\phi '_{\rm r}}+\left( {{u_{\rm a}}-{u_{\rm w}}} \right)\;{\left(\frac{{\theta - {\theta _{\rm i}}}}{{{\theta _{\rm s}}- {\theta _{\rm i}}}}\right)^{{\kappa _{\rm r}}}}\;\tan \; {\phi '_{\rm r}}$ | (6) |
where
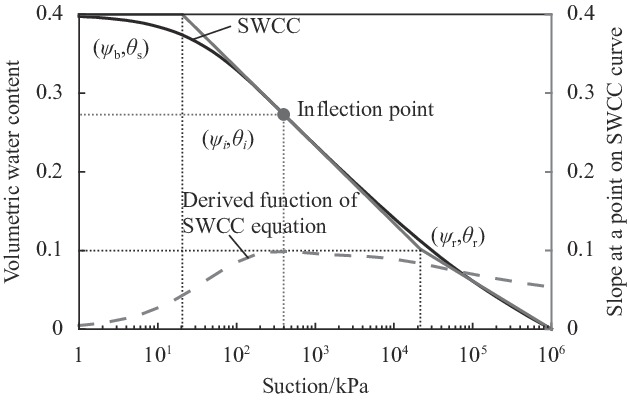 |
| Fig. 1 Salient features of the soil-water characteristic curve (SWCC) |
Eq. (6) only requires the information of conventional SWCC to predict the RSS. However, experimental results using modified ring shear apparatus are required for estimating the fitting parameter value
Geotechnical engineers understand the importance of RSS in the slope stability analysis of both saturated and unsaturated soils. However, research studies related to the application of the RSS concepts in the analyses of unsaturated soils slope are limited in comparison to saturated soils[7]. Most of current research studies related to the stability analyses of unsaturated soils focus on the slope failure caused by rainfall infiltration. In such cases, typically a saturated zone is formed in the shallow layer of the slope due to the infiltration of rainwater. A shallow landslide tends to occur in the saturated zone that forms due to loss in matric suction. This means the dominant factor controlling slope stability remain to be the saturated shear strength parameters.
This paper introduces a deep-seated reactivated Outang landslide near Three Gorges Dam in China caused by the combined influence of rainfall infiltration and the Yangtze River water level variation at the slope toe. Laboratory experiments and site investigations related to this case study from the literature are summarized. A slope stability analysis is undertaken using commercial software Geoslope based on the PSS and the RSS parameters. Furthermore, the influence of rainfall infiltration and Yangtze River water level variation on the factor of safety (FOS) has been investigated and summarized. The results of the study highlight the role of RSS behavior in the slope stability of unsaturated soils.
1 Details of the investigated study area of the case studyThe study area investigated in this paper is situated in the hilly region along the Yangtze River in the Sichuan Basin. The investigated Outang landslide is in Anping, Fengjie, China, which is on the south bank of the Yangtze River. It is about 177 km away from the Three Gorges Dam.
The climate of this region is classified as a humid subtropical monsoon climate. The annual mean temperature and mean precipitation are 16.3 ℃ and 1 147.9 mm, respectively. The total annual precipitation is 1 636.3 mm. However, 70% of total annual precipitation occurs between the months of May and September.
The Yangtze River flows in front of the slope toe, as shown in Fig. 2 (modified after Dai 2016[21]). The water level of Yangtze River in the study area can be regulated by the Three Gorges Reservoir floodgates. The water level is adjusted during rainy season to alleviate possible floods. The Yangtze River water is typically limited to 145 m for flood control from mid-June to the end of September (i.e., rainy season); however, it varies between 145 m and 175 m during other months.
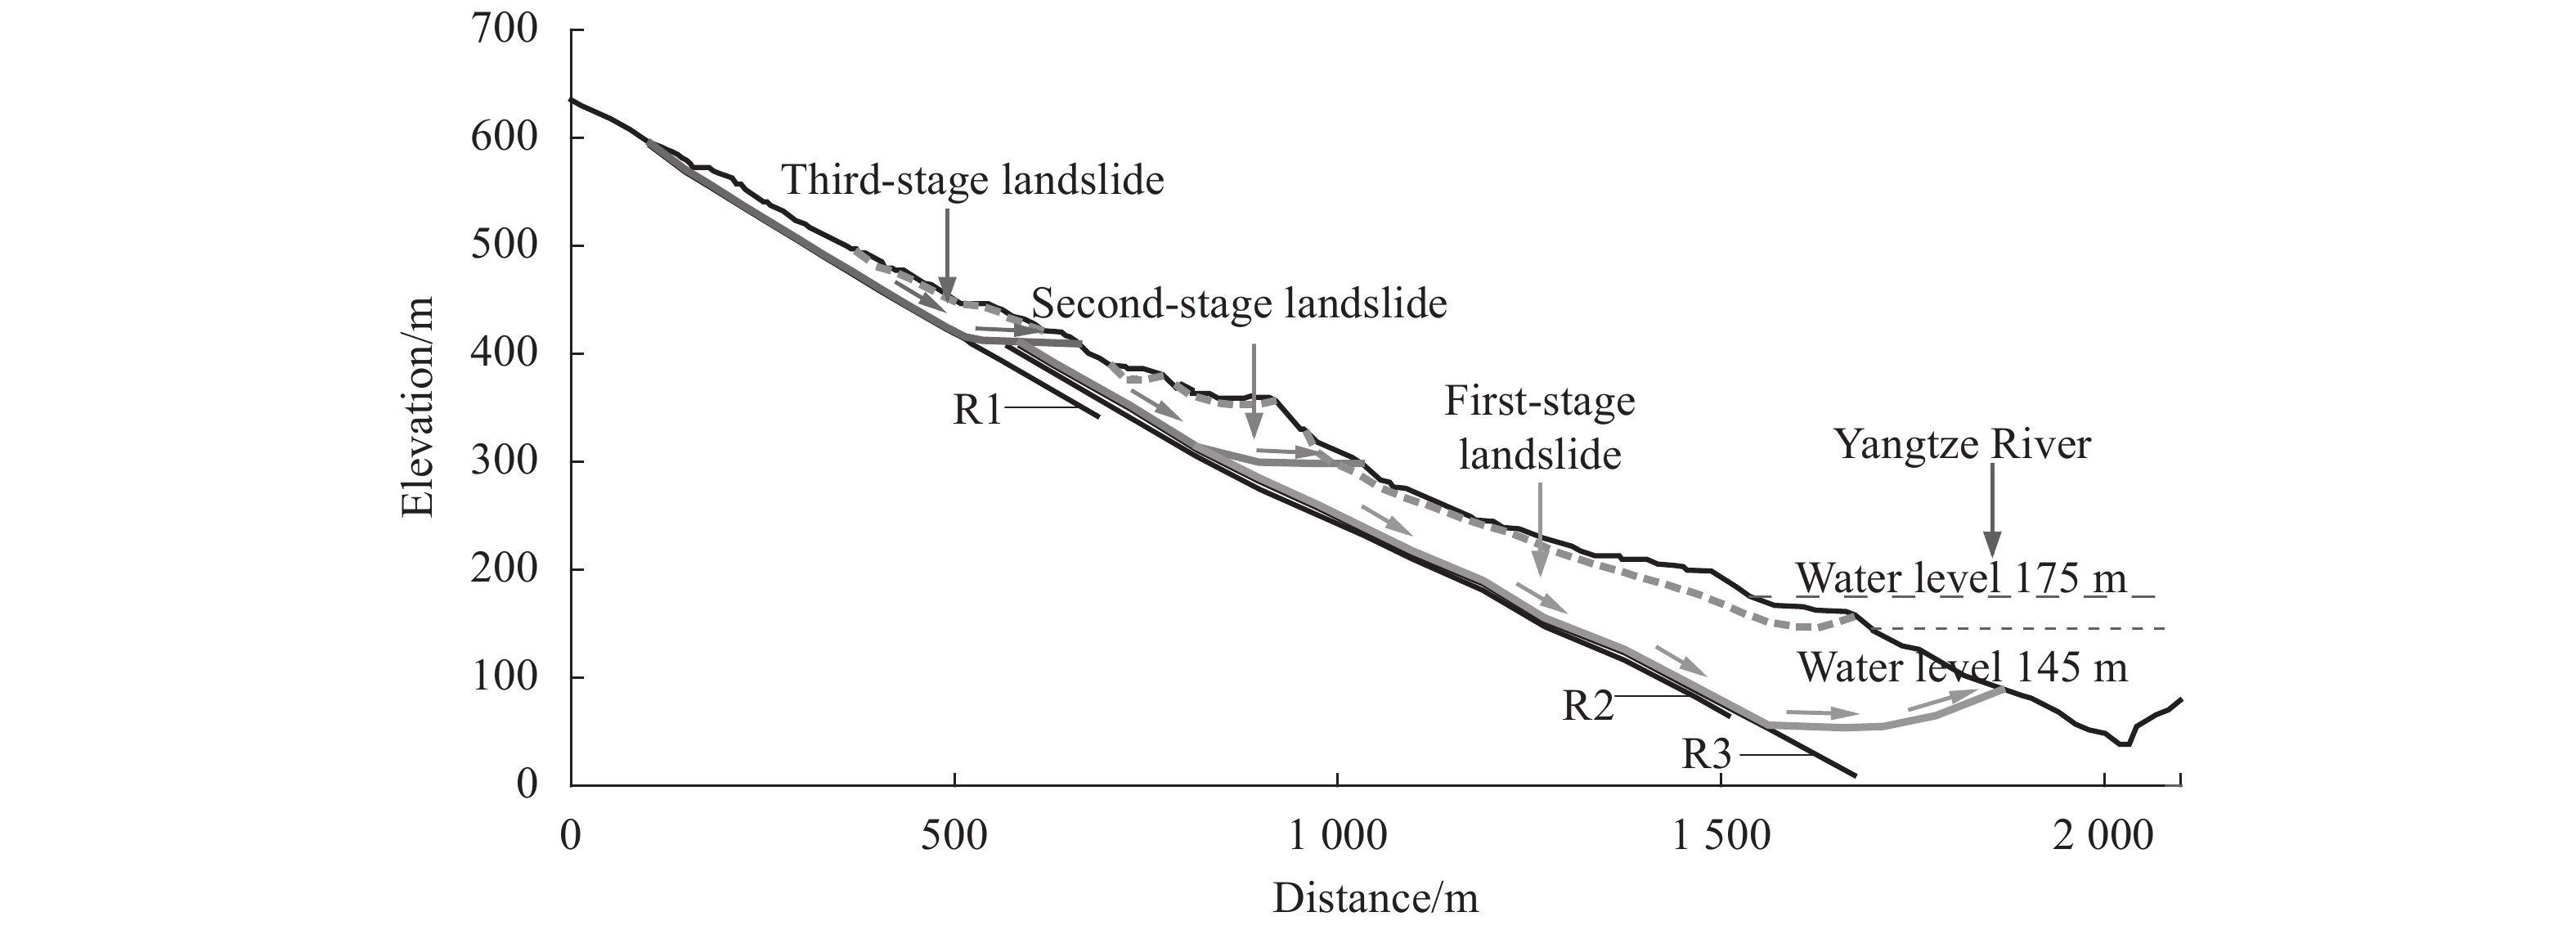 |
| Fig. 2 Typical cross section of the Outang landslide |
2 Site investigation studies 2.1 Description of Outang landslide
The total length of Outang sliding mass is 1800 m with an average thickness of 50.8 m. The average gradient of the slope surface is 1∶25. The relative difference in elevation between the slope crest and toe is about 600 m. Dai[21] used boreholes, exploratory wells, exploratory trenches and footrill at different positions of the slope to study the slip surface of the Outang landslide. The investigation results indicate three weak zones (shown as R1, R2 and R3 in Fig. 2) which are sandwiched between the sliding mass and bedrock. The sliding mass moved along these weak zones when the landslide occurred. In total, there were three stages in the landslide, which are described below:
1) The first-stage landslide occurred from the midpoint of the slope to the toe of the slope. The length of the sliding mass is about 880 m and the width is about 1 100 m. The average thickness is 70.3 m. The sliding mass moved along the R3 weak zone. It is parallel to the bedrock with an inclination between 18° and 25°. In the zone near leading edge, the slip surface is approximately circular. The toe slides out below the water level of the Yangtze River with an inclination between –15° and 5°.
2) The second-stage landslide is 440 m long, 650 m wide and the average thickness is 32.3 m. The sliding mass also moved along the R3 weak zone with an inclination between 25° and 27°. The toe slides out over the trailing edge of the first-stage landslide with an inclination between –12° and 4°.
3) The third-stage landslide is 640 m long, 830 m wide with an average thickness of 27.2 m. The sliding mass moved along the R1 weak zone with an inclination between 20° and 25°. The toe slides out almost horizontally over the trailing edge of the second-stage landslide.
A series of electron spin resonance (ESR) tests were conducted on the slide zone soil specimens obtained at different positions of the slope. ESR can be used to determine the age and sequence of the three landslides. The results from ESR suggest the first-stage landslide occurred about 120 000~130 000 years ago; the second-stage landslide followed about 49 000~68 000 years ago and finally the third-stage landslide occurred about 47 000~49 000 years ago.
Since the Three Gorges Reservoir began to store water in 2003, the behaviors of the old Outang landslide were influenced significantly. Large displacements of the sliding masses and more than 106 cracks on the ground were observed[21]. Most cracks were observed in the first-stage sliding mass, especially during 2008 and 2009. The second-stage sliding mass was relatively stable. Since then, settlements of the road and cracks of the ground were observed in the third-stage sliding mass every year during the rainy season. These results and observations suggest that the old Outang landslide has been reactivated, locally. This may be attributed to the influence of intense rainfall and significant variation of the Yangtze River water level.
2.2 Soil properties of Outang landslideThe site investigation studies (e.g., borehole, exploratory well, and footrill, etc.) have shown that the Outang sliding mass mainly consists of silty clay mixed with gravels and broken rock. The surface layer of sliding mass is the silty clay with gravels, the thickness of which is about 3~20 m. Underlying the surface layer, there is broken rock with a thickness of 10~85 m. The broken rock layer mainly includes sandstone, siltstone and claystone. Three weak zones were sandwiched between the Outang sliding mass and bedrock. Only the two weak zones (i.e., R1 and R3) along which the sliding mass moved were studied. R3 is a clay layer with thickness of 40~70 cm. R1 is claystone layer with thickness of 10~35 cm.
Several undisturbed samples were collected from the Outang sliding mass and weak zones. The degree of saturation,
| Tab. 1 Physical properties of soils |
 |
| Tab. 2 Shear strength parameters of soils |
 |
The shear strength properties of natural (i.e., unsaturated) and saturated specimens suggested that the shear strength of natural specimens reduced when they were saturated (see R1 for example). The peak cohesion,
The RSS parameters were lower than the peak values (see R1 details, for example in Tab. 2). The cohesion and angle of internal friction for peak and residual conditions decreased by 34.66% and 21.49%, respectively for saturated specimens. The reduction in saturated shear strength from peak to residual value can be attributed to the reorientation of the platy clay particles[8]. The clay particles will be aligned parallel to each other on the failure shear surface. As a result, the peak shear strength decreased to residual value.
In addition, for the unsaturated R1 specimen, the soil cohesion decreased by 44.66% and the angle of internal friction decreased by 28.33% under large deformation. This means the reduction in shear strength from peak to residual conditions under unsaturated soil conditions is greater than that of the saturated soil. This can be attributed to reduction in the saturated soil shear strength parameters (i.e.,
The rainfall data along with the variation of Yangtze River water level in the slope are summarized in Fig. 3 (modified after Dai, 2016[21]).
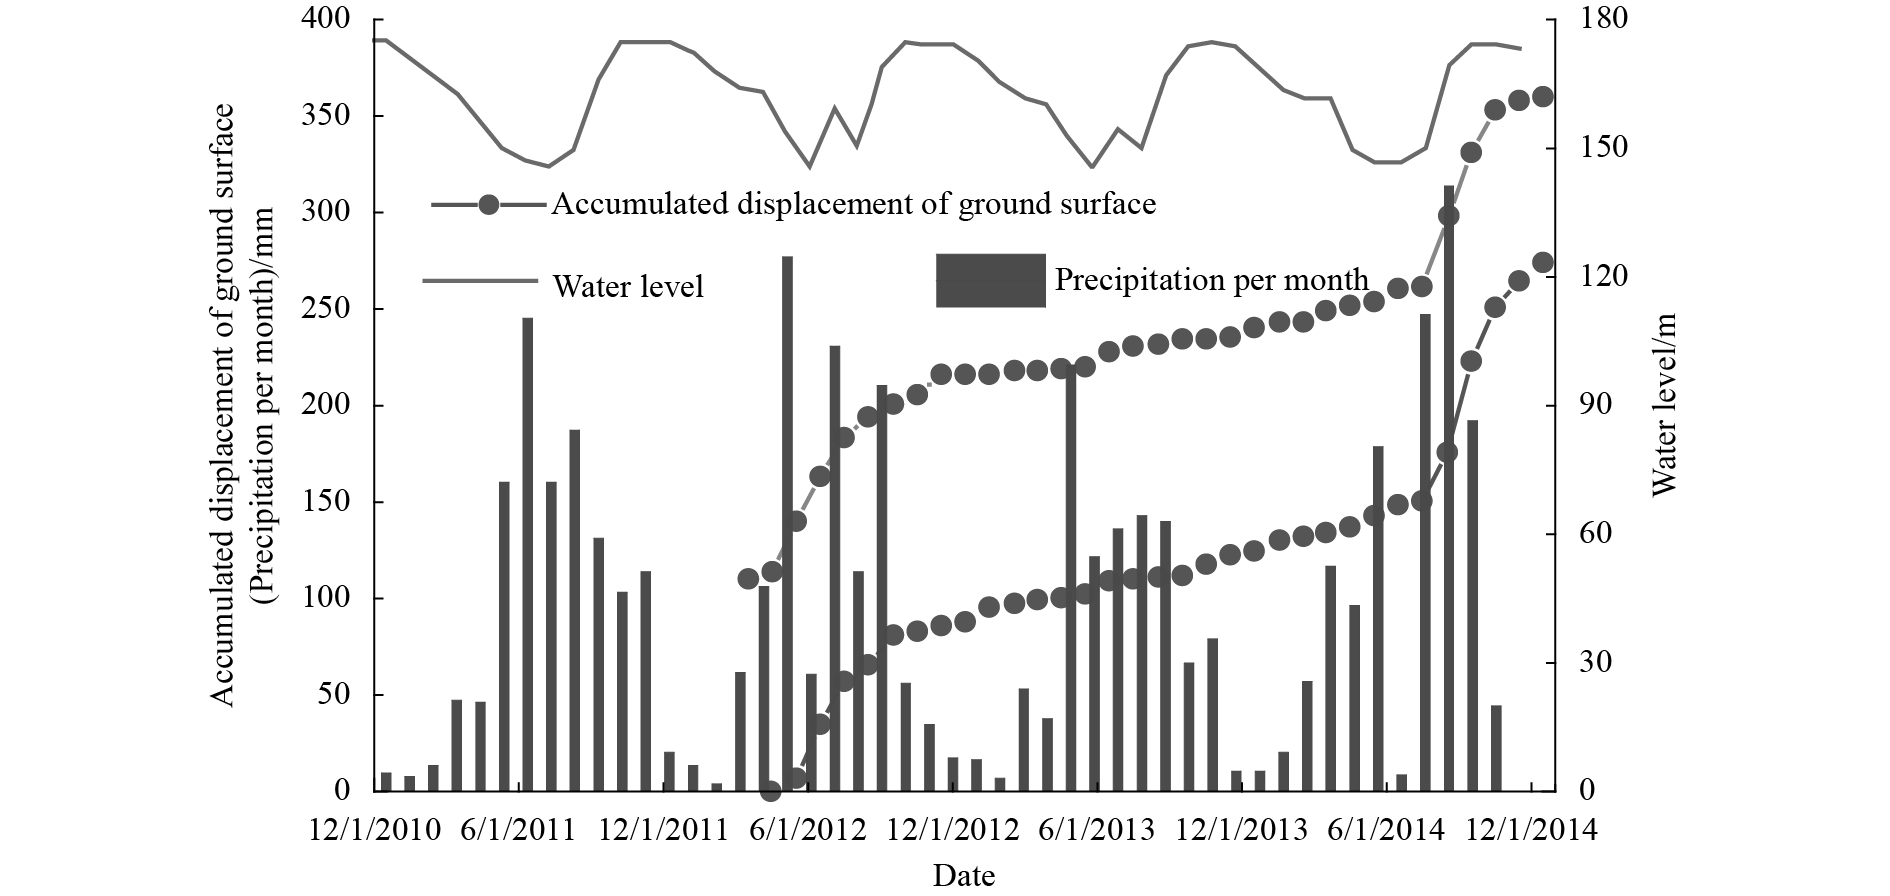 |
| Fig. 3 Variation of the Yangtze River water level, precipitation and accumulated displacement of ground surface |
From Fig. 3, it can be seen that the precipitation varied periodically. The precipitation was relatively high from May to September, which is the rainy season period. However, it decreased significantly after this period and reached a minimum value between January and March. The water level of Yangtze River reduced from 175 m to 145 m from May to September as a flood control measure during the peak period of rainfall. However, between January and March, Yangtze River water level increased gradually and reached 175 m.
Dai[21] measured the accumulated displacement of the ground surface using GPS. Two typical variation curves of the accumulated displacement with time are also shown in Fig. 3. Both the monitor points were located in the third-stage landslide. The accumulated displacements increased significantly from May to September in 2012 and 2014. However, the increase in rates of accumulated displacements during these two periods were much higher than that during the corresponding period in 2013.
The variation of increase rate of accumulated displacement is consistent with the variation of average precipitation rate. The fluctuations of Yangtze River water level were similar from May to September in 2012 and 2013. The accumulated displacement increased significantly during this period in 2012 in comparison to 2013. These displacements were consistent with the precipitation rates in 2012 and 2013; it can be seen from Fig. 3 the precipitation rate in 2013 was lower than that in 2012. Therefore, it is reasonable to conclude that the variation of water level alone cannot trigger the large displacement of ground of third-stage sliding mass. This means that the increase in accumulated displacement of the third-stage sliding mass was caused by not only the water level variation, but also due to the heavy precipitation. This can also be explained by the reduction in both the peak and residual shear strength due to saturation, which is summarized in Tab. 2. The soils in R1 was saturated by the rainfall infiltration. Due to this reason, saturated shear strength parameters should be used for natural soils. As a result, the accumulated displacement of the sliding mass also increased significantly. Additionally, once a large displacement was triggered by the heavy precipitation, the shear strength decreased from peak to residual value. In other words, there was a further decrease in shear strength due to larger displacement.
3 Slope stability analyses 3.1 Schematic of slope used for numerical modellingNumerical modelling was conducted using the commercial software GeoStudio to study the stability of this slope based on the PSS and the RSS parameters. The schematic of the investigated slope is shown in Fig. 4 highlighting several key details. The mixed quad and triangle elements were used to generate the mesh. The approximate global element size was 30 m.
 |
| Fig. 4 Schematic of the slope used in the numerical modelling |
However, in order to build the numerical model, some assumptions have been introduced. Firstly, the surface of the slope was simplified. Only the main variations of gradient were introduced into the numerical model. Some minor variations of gradient were not considered. Secondly, only parts of R1 and R3 overlapping with the slip surface were presented in the numerical model. The thickness of R1 and R3 were set as 0.5 m. Lastly, the three landslides that have occurred in a sequence were considered to occur at the same time. This means the soils above the slip surface was considered to be sliding mass as a whole.
The seepage and slope stability analysis were conducted considering three different scenarios, which included: 1) the influence of precipitation with Yangtze River water level at constant value of 175 m; 2) the influence of decrease in Yangtze River water level from 175 m to 145 m; 3) considering the combination influence of precipitation and decrease in Yangtze River water level.
3.2 Numerical analysesNumerical analyses involved four steps, which are summarized below:
1) Steady-state seepage analysis. A steady-state seepage analysis was conducted with a constant total head on the left boundary and the slope surface below the Yangtze River water level. The initial pore water pressures can be simulated in the slope under no precipitation and variation of water level.
2) Transient seepage analysis. In each scenario, a specific type of boundary conditions was applied on the surface of the slope to model the precipitation and variation of water level. Then, a transient seepage analysis was conducted to calculate the pore water pressures in the slope at different times based on the initial pore water pressures obtained in Step 1).
3) Slope stability analysis. In each scenario, a series of values of FOS can be calculated using the Morgenstern–Price method and PSS parameters based on the obtained pore water pressures at different times calculated in Step 2). Therefore, the variation of the FOS calculated using PSS (FOSP) with time can be obtained for each scenario.
4) Slope stability analysis. Step 3) can be repeated replacing PSS parameters with the RSS parameters. The variation of the FOS can be calculated using RSS (FOSR) with time for the three different scenarios.
3.3 Boundary conditionsA no flow boundary condition was applied on the right and bottom boundaries, i.e. the unit flux
In the steady-state seepage analysis, a constant total head of 175 m was applied on the slope surface below the elevation of 175 m.
From Fig. 3, it can be found that the precipitation was lowest in February; this value was close to zero. The precipitation increased gradually and reached the highest value during the month of May. The precipitation values were typically high from May to September. Due to this reason, the water level of Yangtze River was highest at 175 m during February and decreased gradually to a low level from May to September.
Since the precipitation varied periodically, only a representative period of one year (Feb. 2012—Feb. 2013) was selected for the study. The shear strength decreased during the wet season of this year due to precipitation. The seepage force increased during this period due to the decrease in water level, which accelerated the slope failure. Therefore, the wet (i.e., mostly the rainy) season is the most vulnerable period. For this reason, only the wet period from Feb. 2012 to Sep. 2012 was studied in this research.
Finally, a transient seepage analysis was conducted for a duration of 7 months. The precipitation and water level variations have been simplified as shown in Fig. 5. The actual precipitation and Yangtze River water level from February to September in 2012, were also presented in Fig. 5. It can be found precipitation values used in the modelling can approximately fit the actual condition. However, actual precipitations in April and June were significantly lower than that in the modelling. The precipitation was assumed that it extended continuously for five months in the modelling. In other words, the assumptions used for the analysis would contribute to conservative numerical results.
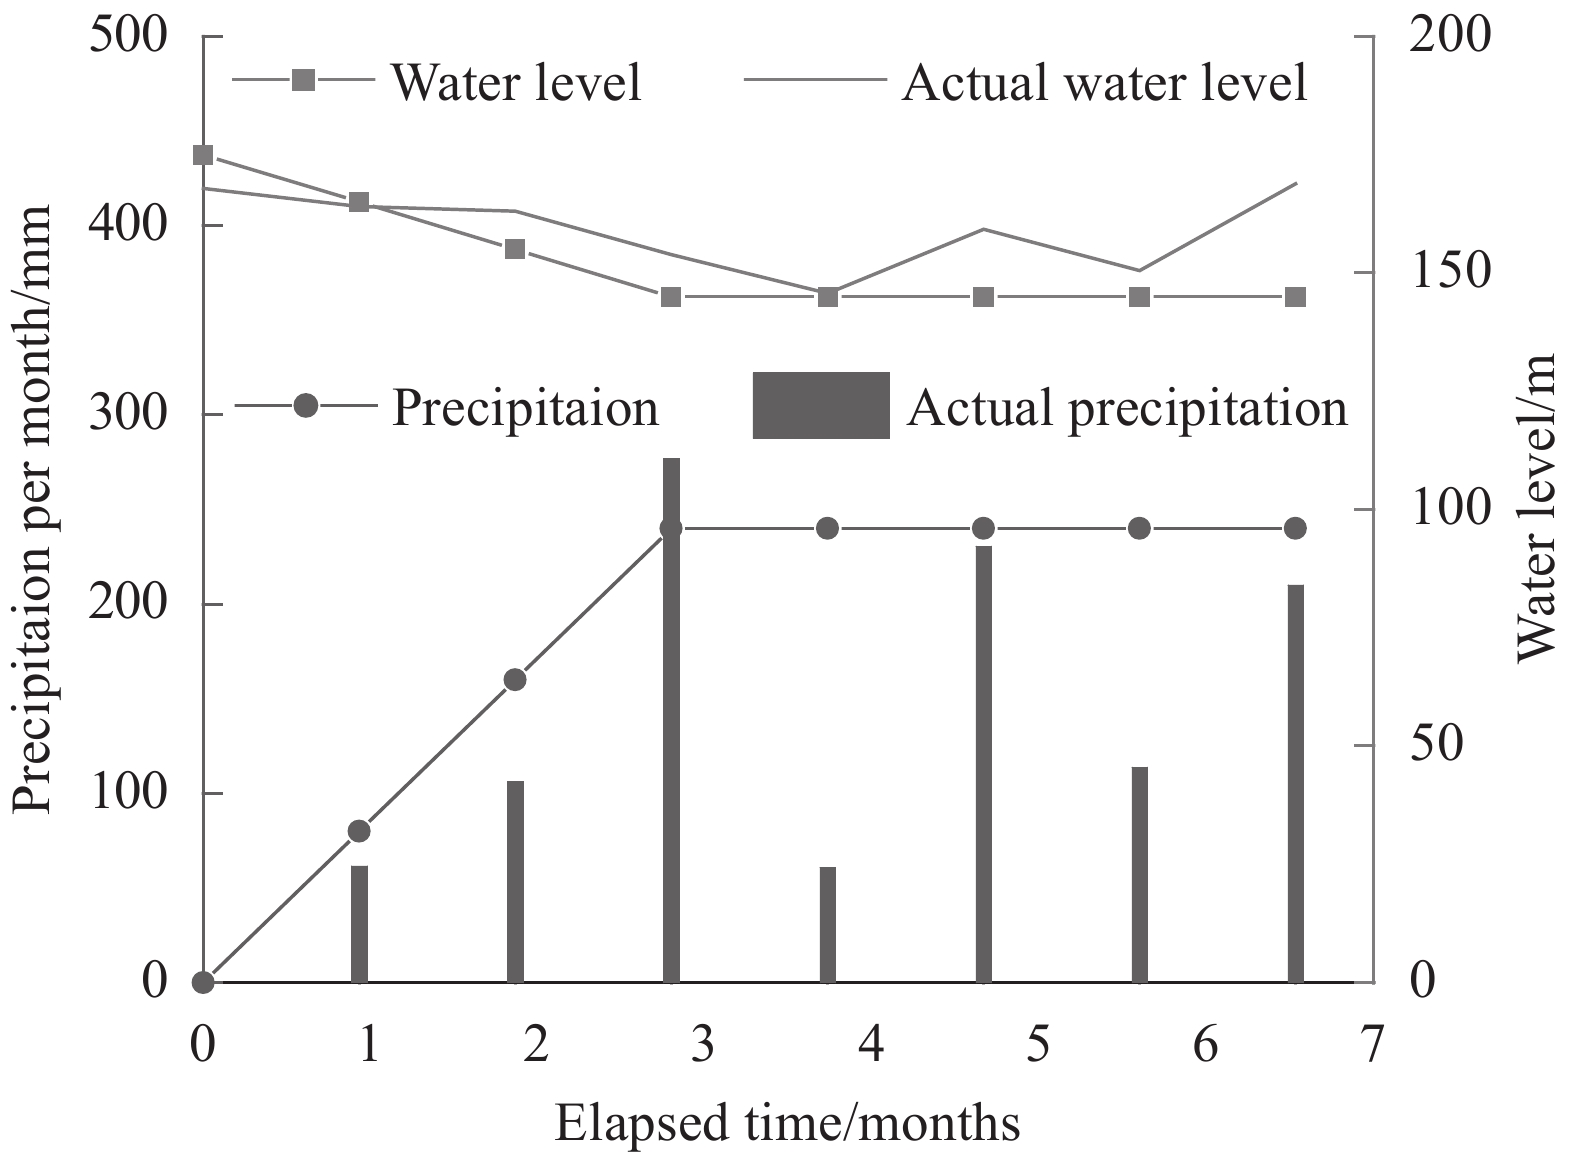 |
| Fig. 5 Variation of actual and assumed values of precipitation and Yangtze River water level used in the numerical model (Feb. 2012—Sep. 2012) |
In the transient seepage analysis, a varied unit flux with time was applied on the slope surface above the elevation of 175 m. The unit flux was defined as a function of the elapsed time. Initially, the unit flux was zero and then it increased linearly to 240 mm/month after 3 months. Finally, it was constant at 240 mm/month from the 3rd to the 7th month.
A varied total head with time was applied on the slope surface below the elevation of 175 m. Initially, the total head was 175 m and then it decreased linearly to 145 m after 3 months. Finally, it was constant at 145 m during the following 4 months (i.e., from May to September).
By default, when the total head was lower than the elevation, the boundary condition was set as no flow boundary (i.e. total flux is equal to zero). This is not consistent with the actual boundary condition. For an actual slope, once the water level decreased, the constant total head boundary on the exposed slope surface should be replaced by a rainfall infiltration boundary. However, in this numerical model the rainfall infiltration was neglected on this part of surface between the elevation of 175 m and 145 m. In this model, the slip surface was seated at a depth of more than 100 m in the zone near the river. The numerical results suggested that the 7-month rainfall infiltration could only create a saturated zone within a shallow layer (about 3 m below the surface).
3.4 Material propertiesFive different types of materials were used in this numerical model. They were R1, R3, silty clay, broken rock and bedrock respectively (shown in Fig. 4).
The Mohr–Coulomb model was used for all those materials. Since effective shear strength parameters were not provided by Dai[21], the PSS and RSS shown in Tab. 2 were used for R1, R3 and silty clay. The parameters of the R1 and R3 were derived from consolidated undrained direct shear test results. The corresponding parameters of silty clay were obtained from quick undrained direct shear test results. This approach will underestimate the magnitudes of the factor of safety (FOS). The research focus of this study is related to the slope stability taking account of RSS parameters. Due to this reason, the magnitudes of the FOS values were underestimated; however, the trends in the variation of FOS would be similar when shear strength is reduced from the peak value to residual value. The influence of residual state can still be analyzed by comparing the FOS calculated using peak and residual shear strength, in spite of not using the effective shear strength parameters in this study. The saturated unit weight values of different materials are summarized in Tab. 1.
Dai[21] did not provide experimental results about the shear strength parameters of the broken rock and bedrock and the hydraulic behaviors of all the five materials. However, Dai conducted a numerical modelling study of the landslide. In the numerical models, the hydraulic and mechanical properties of those materials were suggested. Dai indicated that those suggested values were proposed based on experimental results. The properties of similar materials in Three Gorges Dam region were used as a reference. Back calculations were also used to determine the parameters based on the ground water table and slope surface displacement measurements.
In this research, the PSS parameters of broken rock and bedrock were from the numerical studies reported by Dai[21](shown in Tab. 3). Additionally, the RSS parameters were not provided for the broken rock and bedrock by Dai[21]. The slip surface only passed through the R1 and R3 weak zones. This means the FOS was controlled by the shear strength parameters of R1 and R3. The shear strength of broken rock and bedrock did not influence the FOS significantly. Therefore, the RSS parameters of those two materials were assumed equal to the corresponding peak values.
| Tab. 3 Shear strength parameters in numerical model |
 |
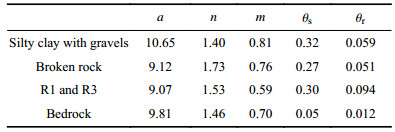
The SWCC and permeability functions that were suggested by Dai[21] were used in the numerical analyses. The same SWCC and permeability functions were used for the R1 and R3 since they are both clays. The equation proposed by Fredlund & Xing [23] was used to fit the SWCC. The parameter related to residual suction
| Tab. 4 Parameters of SWCC |
 |
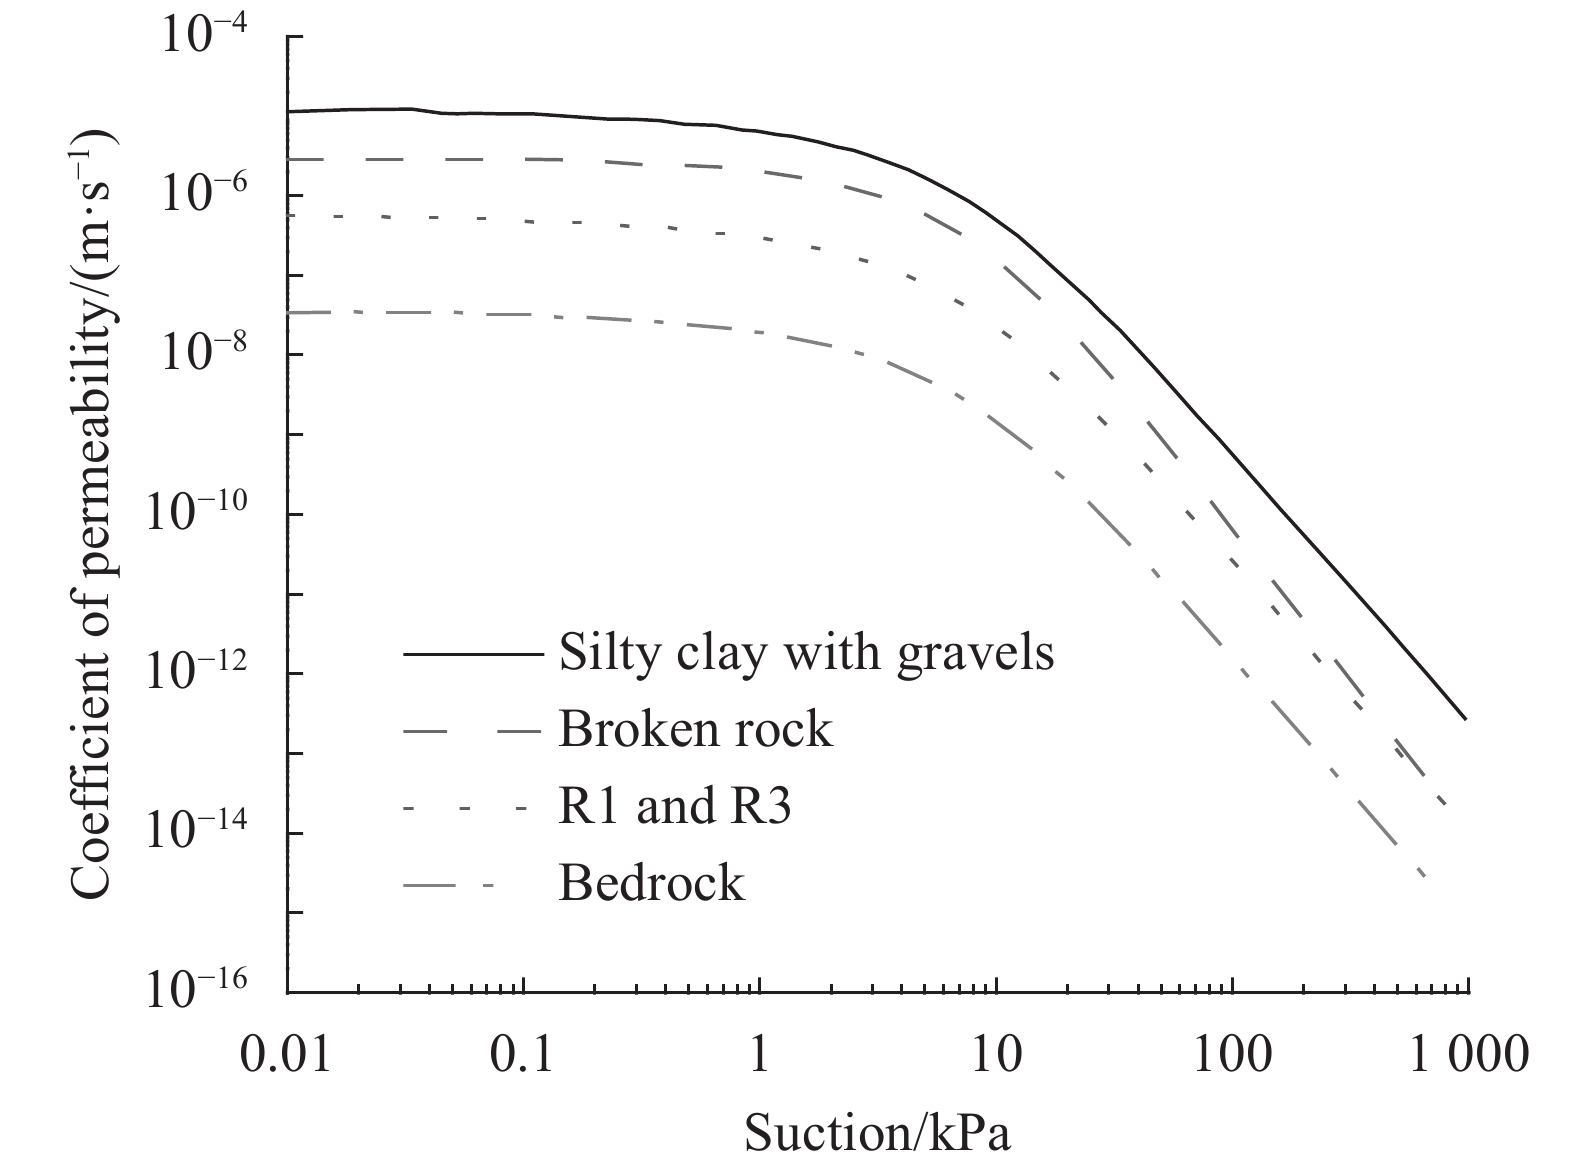 |
| Fig. 6 Coefficient of permeability functions for different materials |
The PSS of those materials under unsaturated condition can be predicted using Eq. (4). This equation has been used as an add-in equation in the Geo-slope. Thus, only four parameters (
| ${\tau _{\rm r}}\!=\!{c'_{\rm r}}\!+\!\left( {{\sigma _{\rm n}}-{u_{\rm a}}} \right)\;\tan \; {\phi '_{\rm r}}+\left( {{u_{\rm a}}\!-\!{u_{\rm w}}} \right)\;\left(\frac{{\theta - {\theta _{\rm r}}}}{{{\theta _{\rm s}}\!-\!{\theta _{\rm r}}}}\right)\;\tan \; {\phi '_{\rm r}}$ | (7) |
It is important to note that the actual RSS is lower than the RSS calculated using Eq. (7). This is because the normalized volumetric water content,
The Morgenstern–Price method was used to calculate the FOS. The half-sine function was selected as the interslice force function. The slip surface was specified manually before the slope stability analysis, which is shown in Fig. 4. The slip surface consisted of three parts. The rear part of the slip surface went through the R1 weak zone. The medium part went through the R3 weak zone. The front part seemed to be circular and went through the interface between broken rock and bedrock.
In Morgenstern–Price method, two independent FOS equations were used; one with respect to moment equilibrium,
| ${F_{\rm m}} = \frac{{\displaystyle\sum {\left(c'\beta R + NR\tan\; \phi ' - {u_{\rm w}}\beta R\dfrac{{\theta - {\theta _{\rm r}}}}{{{\theta _{\rm s}} - {\theta _{\rm r}}}}\tan\; \phi '\right)} }}{{\displaystyle\sum {Wx - \displaystyle\sum {Nf + \displaystyle\sum {Aa} } } }}$ | (8) |
| ${F_{\rm f}} \!=\! \frac{{\displaystyle\sum {\left(c'\beta \!+\! N\tan\; \phi ' \!-\! {u_{\rm w}}\beta \dfrac{{\theta - {\theta _{\rm r}}}}{{{\theta _{\rm s}} - {\theta _{\rm r}}}}\tan\; \phi '\right)\cos\; \alpha } }}{{\displaystyle\sum {N\sin\; \alpha } + \displaystyle\sum A }}$ | (9) |
| $N \!=\! \dfrac{{W \!+\! ({X_{\rm R}}\! -\! {X_{\rm L}}) \!-\! \dfrac{{[c'\beta \sin\; \alpha \!+ \!{u_{\rm w}}\beta \sin\; \alpha \tan\; {\phi ^{\rm b}}]}}{F}}}{{\cos\; \alpha + \dfrac{{\sin\; \alpha \tan\; \phi '}}{F}}}$ | (10) |
where
In SLOPE/W, the seepage force is considered by using the concept of boundary water forces and total weight[25]. This means no seepage forces were applied internal to the sliding mass. Instead, boundary water forces
From Eq. (8)~(10), it can be found that the resistance force included the shear strength on slip surface and the driving force included
Fig. 7 presents the variation of FOS with time considering the influence of rainfall infiltration when the water level is at 175 m. The FOS decreased linearly with time when only the influence of rainfall infiltration is considered. The total reduction in both FOSP and FOSR in general was relatively small despite 7-months precipitation period.
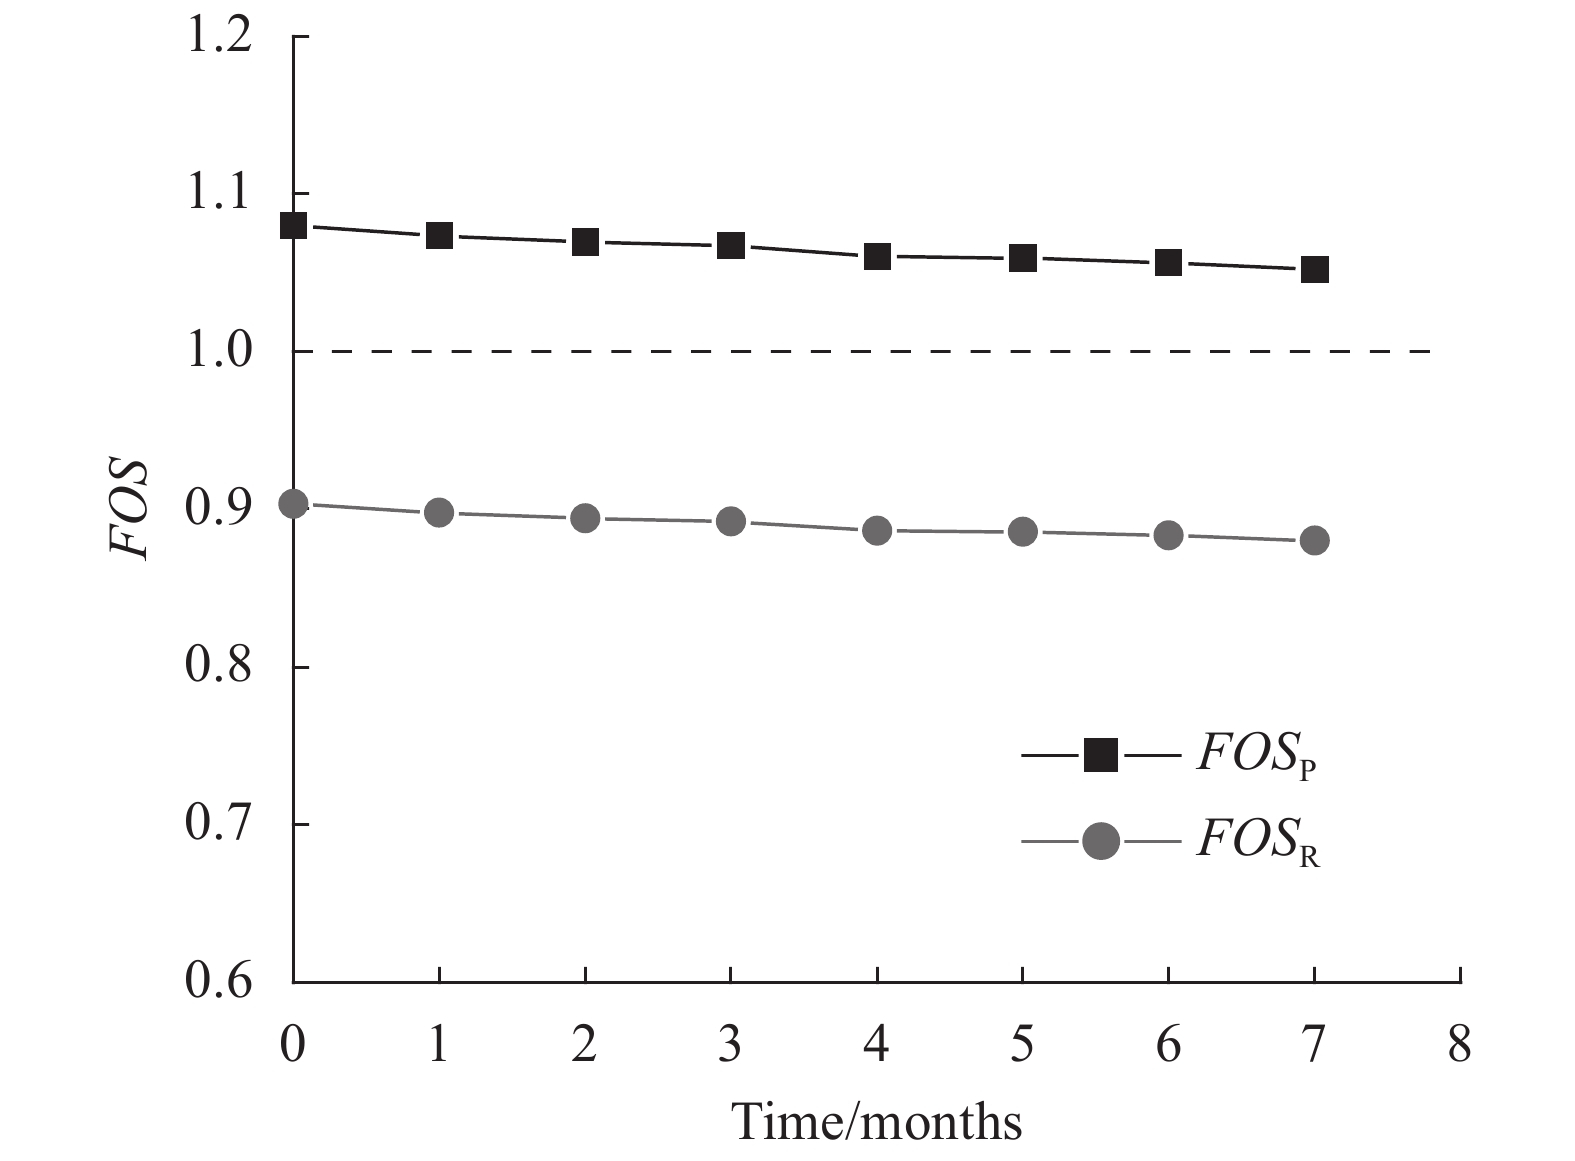 |
| Fig. 7 Variation of FOS with time taking account of rainfall infiltration |
The reduction in FOS due to rainfall infiltration can be explained in terms of the shear strength on slip surface and the total weight of the sliding mass. Fig. 8 shows the pore water profile along the slip surface at different times (shown in Fig. 5). It can be found under initial condition, only the slip surface going through R1 and the connection part between R1 and R3 were in the unsaturated zone. The remainder part of the slip surface was in the saturated zone. During precipitation, two saturated zones were formed through which the slip surface passed. The first one was formed at the top of the slip surface in R1. The formation of this slip surface can be attributed to the soil layer above the bedrock is thin at this zone (shown in Fig. 9). The infiltrated rainfall can saturate the R1 and sliding mass within a short time period. The second saturated zone was formed at the connection between R1 and R3. In this zone, the bedrock is almost horizontal (shown in Fig. 9). Therefore, the infiltrated rainfall cannot flow downwards along the slope. Consequently, the infiltrated rainfall accumulated above the bedrock and saturated the soils. Once the saturated zones are formed, the shear strength of the slip surface passing through these zones reduced due to loss of matric suction. In addition, the volumetric water content of the sliding mass increased during precipitation. As a result, the total weight of the sliding mass increased. Therefore, under the influence of precipitation, the resistance on the slip surface reduced, while the driving force, W, increased. Consequently, the FOS decreased.
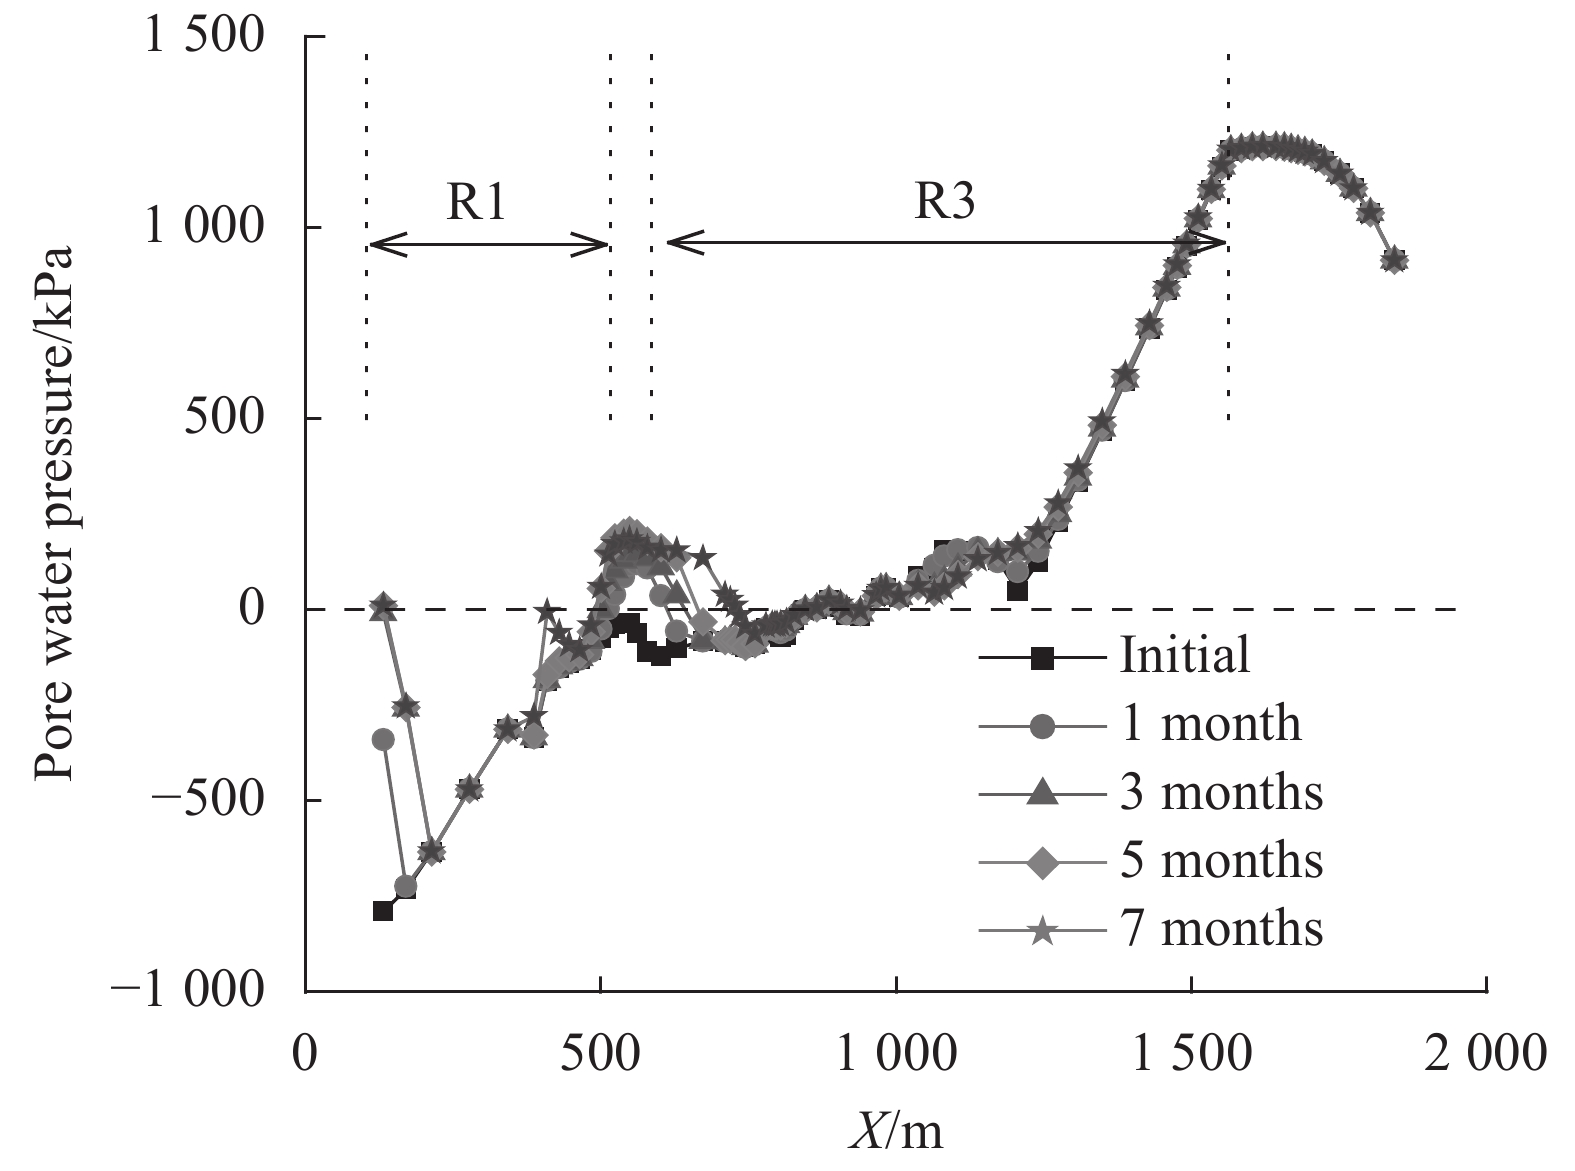 |
| Fig. 8 Pore water pressure profiles along slip surface taking account of rainfall infiltration |
 |
| Fig. 9 Development of the phreatic line in the Outang landslide during precipitation |
However, when matric suction is high, the volumetric water content is low. Thus, the shear strength contribution due to matric suction is relatively small in comparison with the shear strength due to normal stress. Furthermore, the shear strength on most part of the slip surface was not influenced by the precipitation, since they were saturated throughout. In other words, the phreatic line was also not influenced by the precipitation. Such a behavior may be attributed to the thick soil layer (i.e., average thickness is about 50 m) through which only limited amount of rainfall water can infiltrate into the shallow depth. Therefore, reduction in FOS caused by decrease in matric suction and increase in total weight was not significant.
By comparing the FOSP and FOSR, it can be found that FOSR was less than FOSP. The FOSP was greater than 1; however, the FOSR was less than 1. The FOS decreased by about 16% from peak to residual value. Such a behavior can be attributed to lower values of
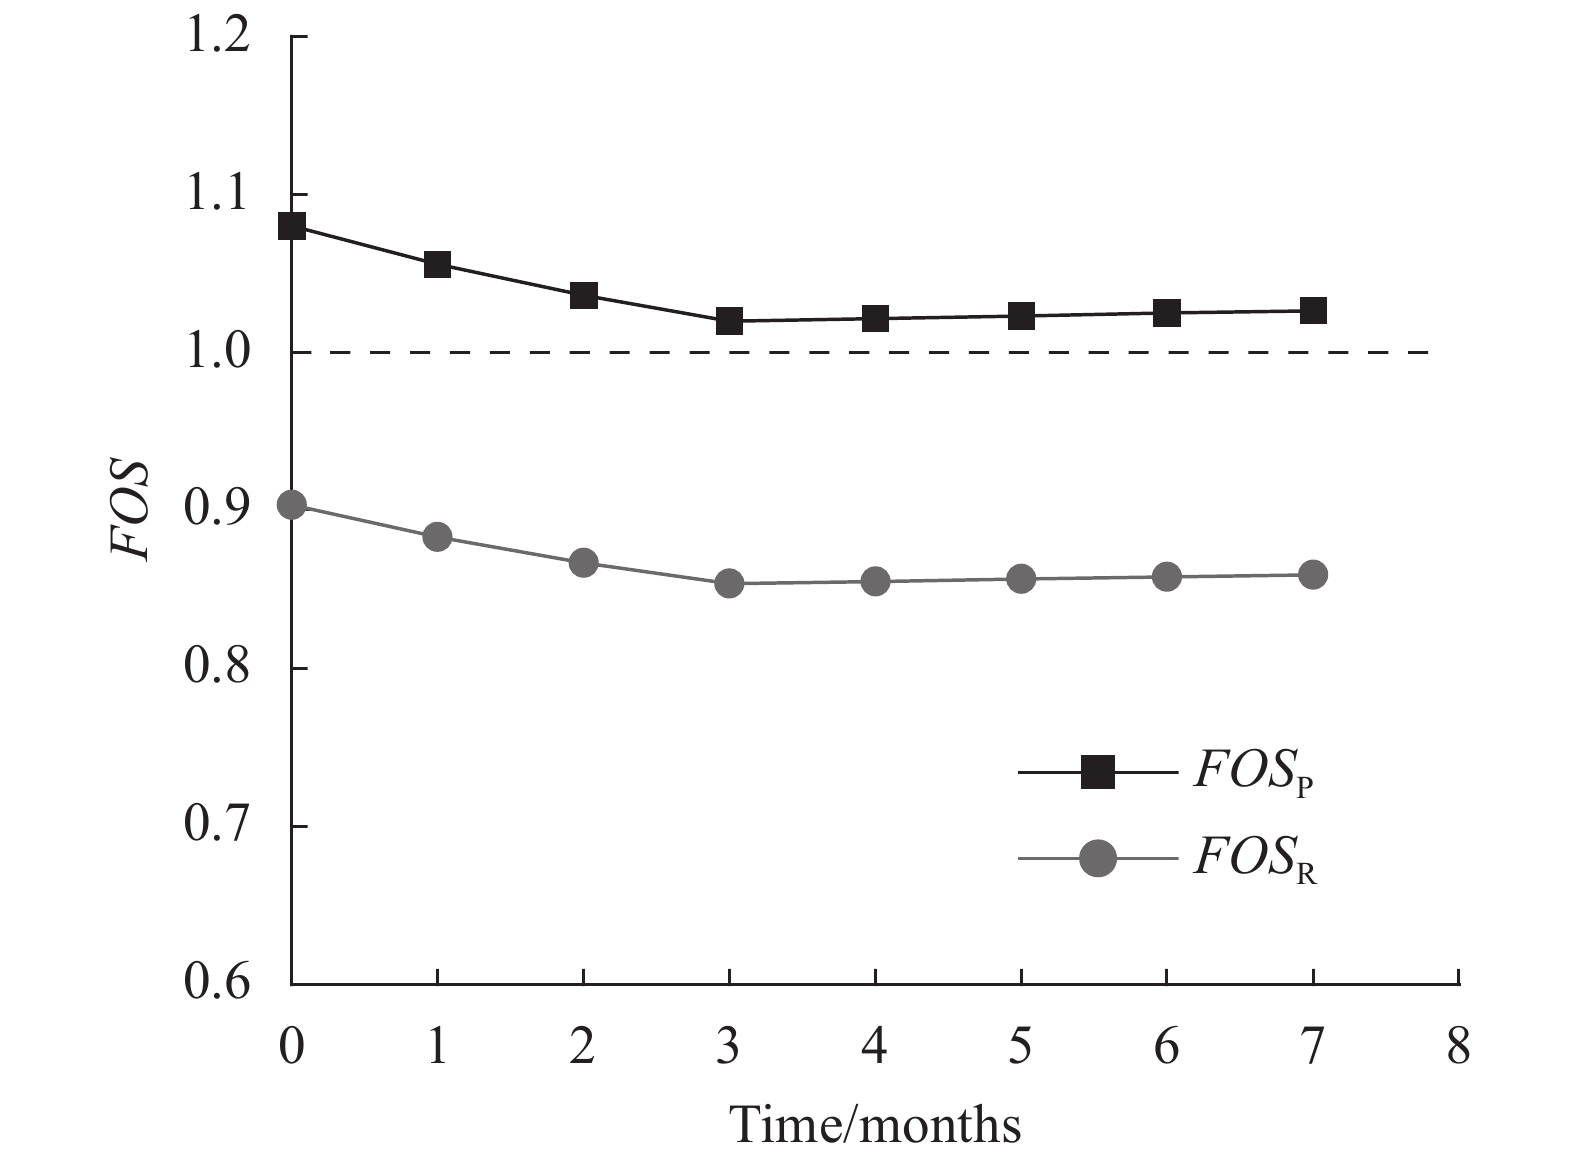
Fig. 10 presents the variation of FOS with time considering only decrease in water level. The FOS decreased rapidly and linearly with time within the first three months. By the third month, both FOSP and FOSR have decreased by 5.5%. After that, FOS increased slightly with time. However, the increase in FOS is relatively small. From the third to the seventh month, both FOSP and FOSR increased only by 0.65%.
 |
| Fig. 10 Variation of FOS with time considering Yangtze River water level variation |
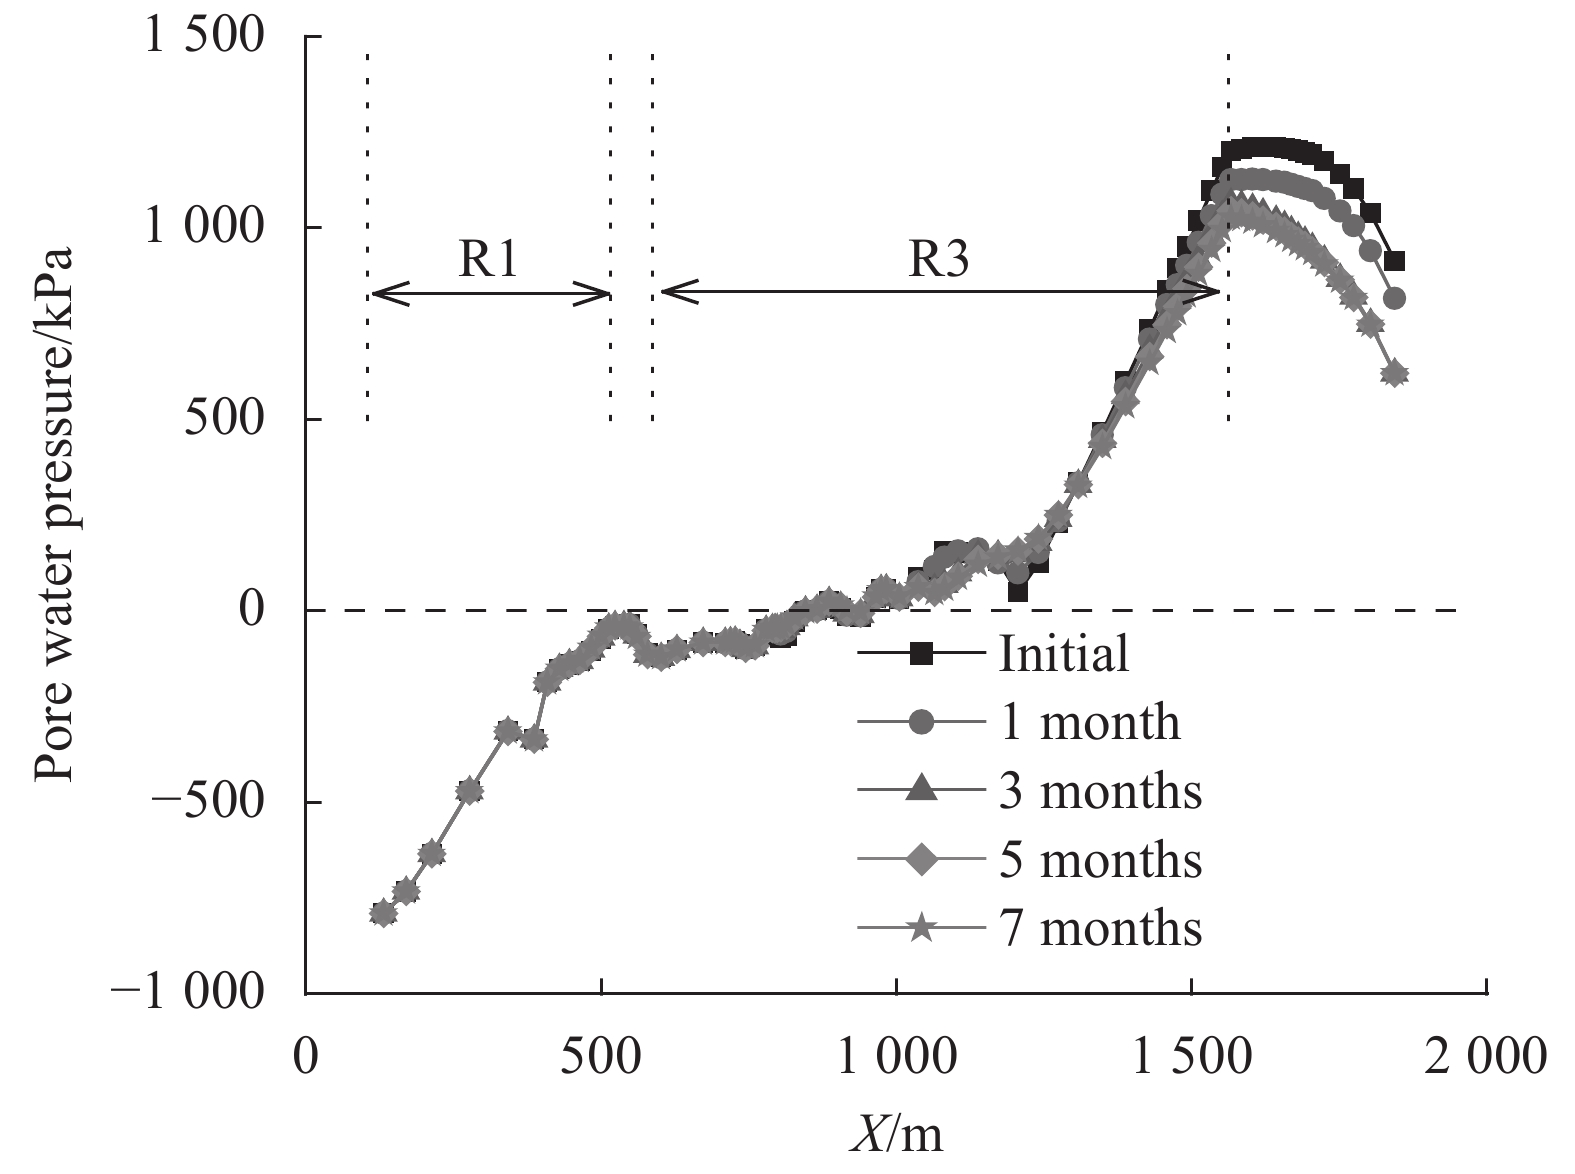
Fig. 11 shows the pore water pressure profiles along the slip surface at different times (shown in Fig. 5). It can be found that only the pore water pressure on the circular part of the slip surface was influenced by the water level variation. The pore water pressure and volumetric water content were not influenced by the variation in water level for most part of the slope. These results are consistent with the field observations that the water level variation alone cannot trigger the large displacement of ground of third-stage sliding mass. This means the shear strength on the slip surface and total weight of sliding mass were not influenced significantly by the water level variation. Therefore, the reduction in FOS can be mainly attributed to the increase in the total water force caused by the decrease in water level.
 |
| Fig. 11 Pore water pressure profiles along Outang landslide slip surface considering water level variation |
After three months, the water level decreased to the minimum value and was constant. Due to this reason, the water force was constant after three months. However, the FOS increased slightly during this period. The small increase in FOS from the third to the seventh month can be attributed to the lowering of the phreatic line. Despite the constant water level, the phreatic line in the zone near the river continued moving downwards (Fig. 12). Due to this reason, there was a decrease in volumetric water content of the sliding mass above the phreatic line near the river. As a result, the total weight of this part of sliding mass decreased and contributed to a relatively small increase in the FOS.
 |
| Fig. 12 Development of the phreatic line during water level variation in the Yangtze River |
In addition, the FOSR was lower than FOSP. The FOSP was still greater than 1, while the FOSR was lower than 1. In both scenarios (i.e., 1 and 2) where only rainfall infiltration and water level variations are considered, the FOSR was 16% lower than theFOSP. The influence of water level variation on FOS remained the same no matter PSS or RSS was used in the analysis.
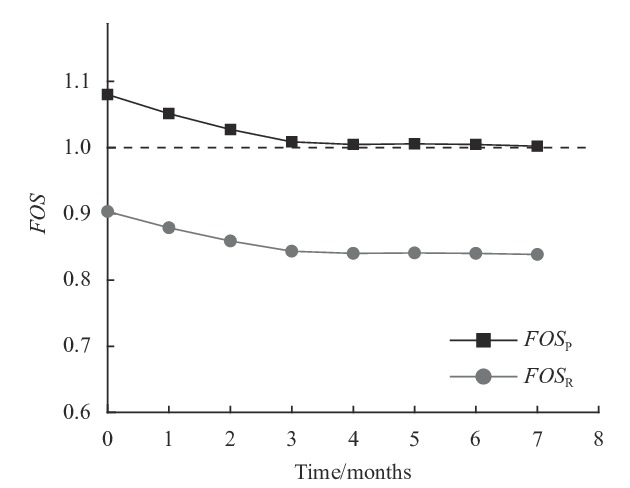
4.3 Scenario 3: Combined influence of precipitation and Yangtze River water level variationFig. 13 presents the variation of FOS with time considering combined influence of both precipitation and decrease in the Yangtze River water level. The FOS decreased linearly with time at a relatively faster rate within the first three months. By the third month, both FOSP and FOSR have decreased by 6.6%. After that, FOS decreased relatively at a slower rate with time. From the third to the seventh month, FOS decreased by 0.66%.
 |
| Fig. 13 Variation of FOS with time considering the combined influence of precipitation and Yangtze River water level variation |
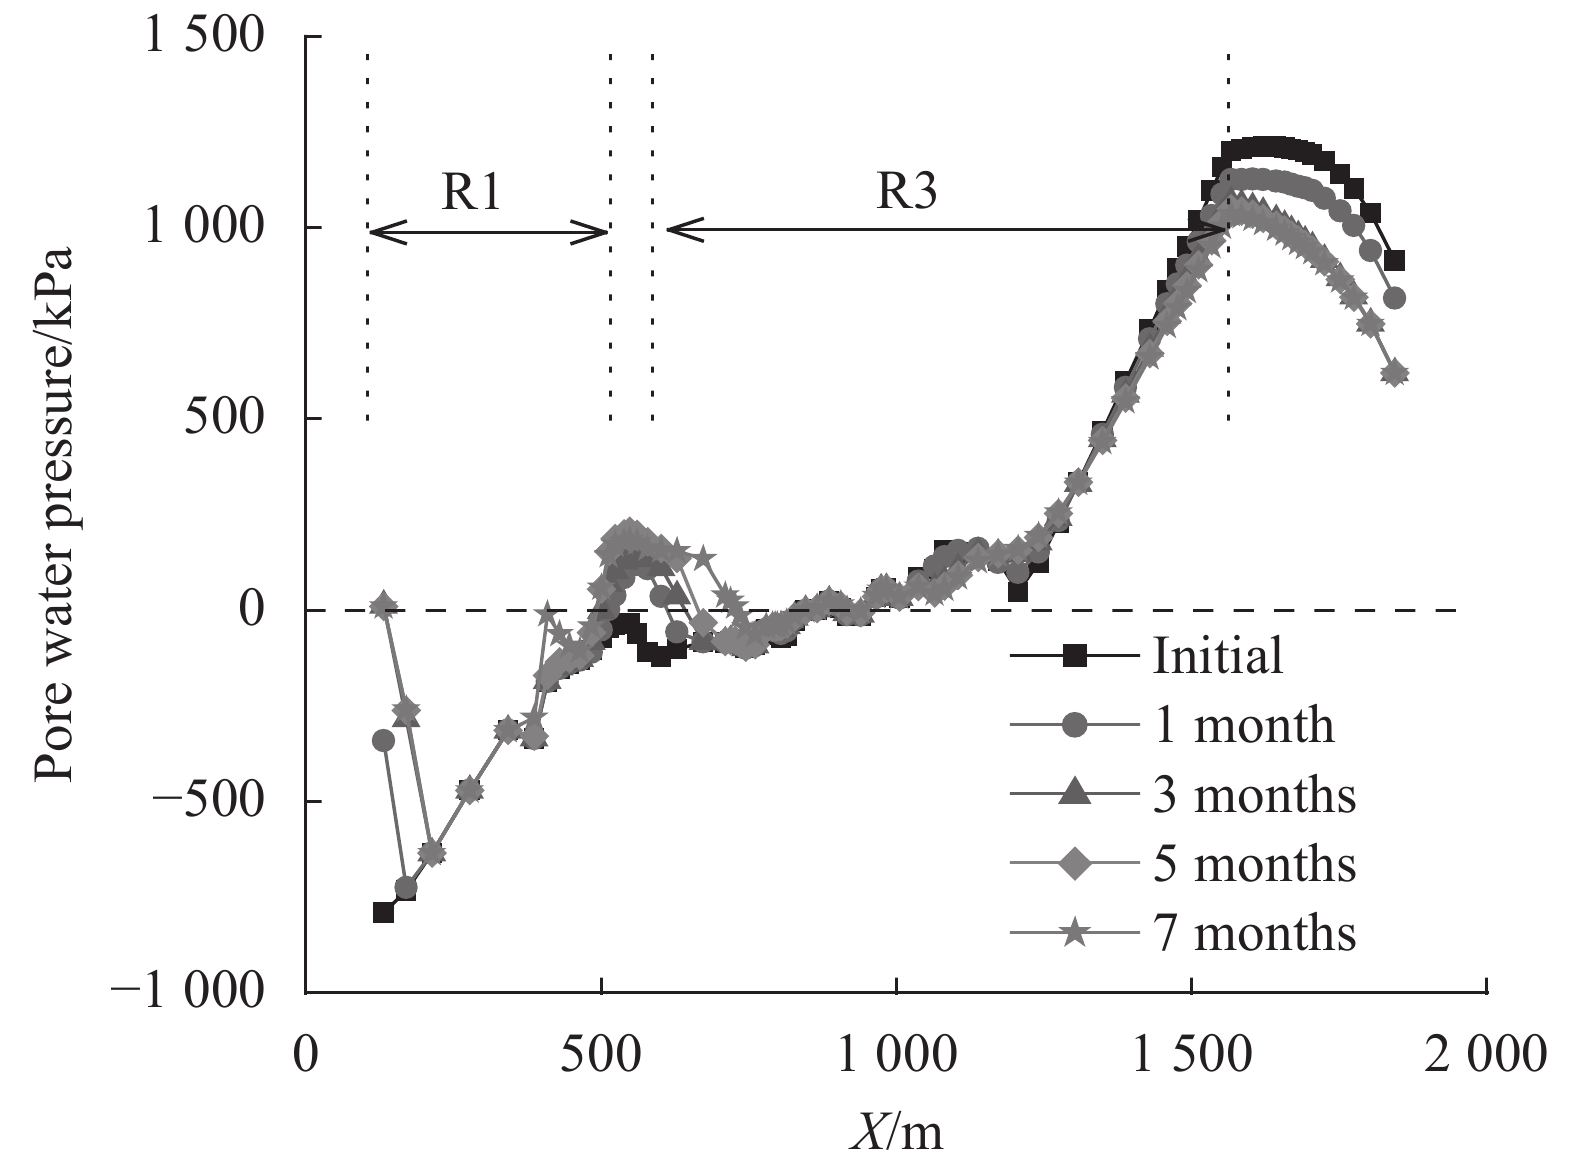
The reduction in FOS can be attributed to the different mechanisms described in section 4.1 and 4.2. Fig. 14 shows the pore water profile along the slip surface at different times (shown in Fig. 5). Firstly, precipitation contributed to saturated zones in the rear part of the slope. This resulted in matric suction decrease on the slip surface and increase in total weight of sliding mass. Secondly, the decrease in water level lead to an increase in the total water force. As summarized in section 4.1 and 4.2, within the first three months, the reduction in FOS caused by Yangtze River water level decrease was greater than that caused by precipitation. Therefore, the decrease in Yangtze River water level was the dominant factor, which contributed to a reduction in the FOS. The influence of precipitation however is secondary. After the third month, the water level was constant with a lowest value and the precipitation was constant at a maximum value (shown in Fig. 5). TheFOS continued to decrease at a slower rate due to the influence of rainfall infiltration.
 |
| Fig. 14 Pore water pressure profiles along slip surface considering the combined effect of precipitation and Yangtze River water level variation |
The FOSR was lower than the FOSP during the seven months. Despite a decrease in FOSP with time under the influence of precipitation and Yangtze River water level variation, it was greater than 1 throughout the 7 months period. The shear strength parameters used in these analyses were derived from consolidated undrained direct tests. The values of FOS can be greater than the current values if the effective shear strength parameters were used. In other words, the slope would be stable throughout the 7 months if the PSS was used in the analysis. These results however are inconsistent with the in-situ slope behavior because of a significantly large displacement that has occurred between the third and seventh month (Fig. 3). For this slope, since a large deformation has occurred, residual values of shear strength should be used instead of peak values. The FOS was overrated due to the use of PSS throughout the slope, which is a limiting case. In other words, the RSS should be considered in the slope stability analysis for reliably modeling the slope behavior.
However, using the RSS throughout the slope is another limiting scenario, which contributes to a lower FOS. Typically, the deformations within a slope are not uniform. In some parts where the deformation is large, the RSS parameters should be used. However, the PSS should be used if the deformation is relatively small. In other words, the variation of shear strength parameters associated with the magnitude of deformation should be established from experimental results. In the present study, a limit equilibrium method was used in the numerical analyses. This approach cannot consider the influence of deformation behavior on the shear strength. For this reason, the RSS was extended for the entire slope. In reality, the calculated FOS of the slope would be somewhere between the FOSP and the FOSR from such an analysis, which is more realistic. Initially, when there was no deformation, the real FOS was equal to FOSP. The water level of Yangtze River will be regulated to reduce its level by Three Gorges Reservoir floodgates when there is a rainfall increase. The combined effect of rainfall infiltration and Yangtze River water level variation contributes to a decrease in the shear strength in the influence zone and an increase in the seepage force. For this reason, the FOS of the slope starts reducing due to an increase in the deformation in some parts of the slope. The slope stability for such a scenario should be interpreted in terms of RSS parameters. The FOS approaches to the FOSR when the soil undergoes large deformation (i.e., as the soil reaches RSS stage).
5 ConclusionsIn this paper, reactivated Outang landslide near the Three Gorges Dam in China was revisited and analyzed. The landslide was activated by the combined influence of rainfall infiltration and Yangtze River water level variation during the recent years (Fig. 3). The results of laboratory experiments and field measurements were used to analyze the failure mechanism associated with this landslide. A series of slope stability analysis were conducted using Geoslope based on the peak shear strength (PSS) and the residual shear strength (RSS) parameters. The following conclusions can be drawn from this study:
1) The site investigations suggested that the heavy precipitation and Yangtze River water level decrease contributed the sliding mass of an old landslide begin to slide again along the weak zones sandwiched between sliding mass and bedrock.
2) For the soils in the sliding zones, the RSS parameters were significantly lower than the peak values. The reduction in shear strength from peak to residual state under unsaturated soil condition was greater than that of saturated soil.
3) The water infiltration associated with the prolonged period of rainfall could reduce theFOS of the slope. The FOS reduction however was small. This could be attributed to the generation of two saturated zones at the rear part of the slope, which contributed to a decrease in the shear strength. However, the extent of saturated zones was still limited.
4) The decrease in Yangtze River water level could decrease the FOS of the slope. However, after Yangtze River water level reached the lowest value, FOS was relatively constant. This could be mainly attributed to the increase in the total water force caused by the decrease in Yangtze River water level.
5) Despite the variations in hydraulic/climatic conditions, FOS decreased by 16%, when the PSS parameters were replaced with the RSS values. If PSS were used in the analysis, the slope would still be stable even under the combined influence of precipitation and Yangtze River water level decrease, which was inconsistent with the field observations. Therefore, the RSS should be considered in the slope stability analysis for reliably modelling the slope behaviors taking account strain softening.
The results of the present study are useful for the geotechnical engineers as they highlight the role of residual shear strength behavior in the slope stability of unsaturated soils.
| [1] |
Widger R A,Fredlund D G. Stability of swelling clay embankments[J]. Canadian Geotechnical Journal, 1979, 16(1): 140-151. DOI:10.1139/t79-012 |
| [2] |
Ochiai H,Okada Y,Furuya G,et al. A fluidized landslide on a natural slope by artificial rainfall[J]. Landslides, 2004, 1(3): 211-219. DOI:10.1007/s10346-004-0030-4 |
| [3] |
Yang K H,Uzuoka R,Lin G L,et al. Coupled hydro-mechanical analysis of two unstable unsaturated slopes subject to rainfall infiltration[J]. Engineering Geology, 2017, 216: 13-30. DOI:10.1016/j.enggeo.2016.11.006 |
| [4] |
Skempton A W. Long-term stability of clay slopes[J]. Géotechnique, 1964, 14(2): 77-102. DOI:10.1680/geot.1964.14.2.77 |
| [5] |
Potts D M,Kovacevic N,Vaughan P R. Delayed collapse of cut slopes in stiff clay[J]. Géotechnique, 1997, 47(5): 953-982. DOI:10.1680/geot.1997.47.5.953 |
| [6] |
Locat A,Jostad H P,Leroueil S. Numerical modeling of progressive failure and its implications for spreads in sensitive clays[J]. Canadian Geotechnical Journal, 2013, 50(9): 961-978. DOI:10.1139/cgj-2012-0390 |
| [7] |
Qi S,Vanapalli S K. Influence of swelling behavior on the stability of an infinite unsaturated expansive soil slope[J]. Computers and Geotechnics, 2016, 76: 154-169. |
| [8] |
Lupini J F,Skinner A E,Vaughan P R. The drained residual strength of cohesive soils[J]. Géotechnique, 1981, 31(2): 181-213. DOI:10.1680/geot.1981.31.2.181 |
| [9] |
Skempton A W. Residual strength of clays in landslides,folded strata and the laboratory[J]. Géotechnique, 1985, 35(1): 3-18. DOI:10.1680/geot.1985.35.1.3 |
| [10] |
Stark T D,Eid H T. Drained residual strength of cohesive soils[J]. Journal of Geotechnical Engineering, 1994, 120(5): 856-871. DOI:10.1061/(ASCE)0733-9410(1994)120:5(856) |
| [11] |
Hawkins A B,McDonald C. Decalcification and residual shear strength reduction in Fuller's Earth Clay[J]. Géotechnique, 1992, 42(3): 453-464. DOI:10.1680/geot.1992.42.3.453 |
| [12] |
Xu C,Wang X,Lu X,et al. Experimental study of residual strength and the index of shear strength characteristics of clay soil[J]. Engineering Geology, 2018, 233: 183-190. DOI:10.1016/j.enggeo.2017.12.004 |
| [13] |
Infante Sedano J A,Vanapalli S K. Experimental investigation of the relationship between the critical state shear strength of unsaturated soils and the soil-water characteristic curve[J]. International Journal of Geotechnical Engineering, 2011, 5(1): 1-8. DOI:10.3328/IJGE.2011.05.01.1-8 |
| [14] |
Hoyos L R,Velosa C L,Puppala A J. Residual shear strength of unsaturated soils via suction-controlled ring shear testing[J]. Engineering Geology, 2014, 172: 1-11. DOI:10.1016/j.enggeo.2014.01.001 |
| [15] |
Romero E,Vaunat J,Merchán V. Suction effects on the residual shear strength of clays[J]. Journal of Geo-Engineering Sciences, 2014, 2(1/2): 17-37. |
| [16] |
Fredlund D G,Morgenster N R N,Widger R A. The shear strength of unsaturated soils[J]. Canadian Geotechnical Journal, 1978, 15(3): 313-321. DOI:10.1139/t78-029 |
| [17] |
Vanapalli S K,Fredlund D G,Pufahl D E,et al. Model for the prediction of shear strength with respect to soil suction[J]. Canadian Geotechnical Journal, 1996, 33(3): 379-392. DOI:10.1139/t96-060 |
| [18] |
Yang X,Vanapalli S K.Slope stability analysis of a slope based on the peak and the residual shear strength of unsaturated soils[C]//Proceedings of 7th International Conference on Unsaturated Soils.Hong Kong,2018.
|
| [19] |
Vaunat J,Amador C,Romero E,et al.Residual strength of a low plasticity clay at high suctions[C]//Proceedings of the Fourth International Conference of Unsaturated Soils,2006,1:1279-1289.
|
| [20] |
Merchán V,Romero E,Vaunat J. An adapted ring shear apparatus for testing partly saturated soils in the high suction range[J]. Geotechnical Testing Journal, 2011, 34(5): 1-12. |
| [21] |
Dai Z W.Study on the deformation and failure mechanism of Outang landslide in the Three Gorges Reservoir Region, China[D].Xi’an: Chang’an University, 2016.
|
| [22] |
Patil U D,Puppala A J,Hoyos L R,et al. Modeling critical-state shear strength behavior of compacted silty sand via suction-controlled triaxial testing[J]. Engineering Geology, 2017, 231: 21-33. DOI:10.1016/j.enggeo.2017.10.011 |
| [23] |
Fredlund D G,Xing A. Equations for the soil-water characteristic curve[J]. Canadian Geotechnical Journal, 1994, 31: 521-532. DOI:10.1139/t94-061 |
| [24] |
Vanapalli S K,Sillers W S,Fredlund M D.The meaning and relevance of residual state to unsaturated soils[C]// Proceedings of the 51st Canadian Geotechnical Conference. Edmonton,1998.
|
| [25] |
GeoSlope International Ltd.Stability modeling with SLOPE/W:An engineering methodology[M].Calgary:GEO-SLOPE International Ltd,2012.
|
 2019, Vol. 51


